Investor Relations
Andrew Kramer
Director, Investor Relations
781.687.8306
investorrelations@interactivedata.com

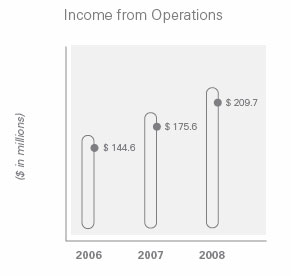
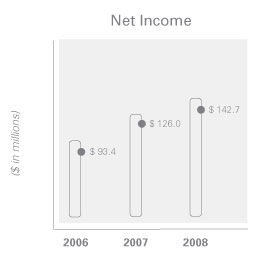
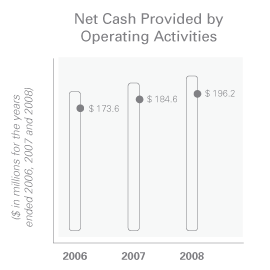
Financial Highlights
| (in thousands, except per share data) | ||||||
| 2006 | 2007* | 2008** | ||||
| Revenue |
$ | 612,403 | $ | 689,610 | $ | 750,541 |
| Income from operations |
$ | 144,565 | $ | 175,620 | $ | 209,683 |
| Net income |
$ | 93,362 | $ | 125,983 | $ | 142,648 |
| Diluted earnings per share | $ | 0.98 | $ | 1.30 | $ | 1.48 |
| Cash dividends declared per common share | $ | 0.80 | $ | 1.15 | $ | 0.65 |
| Diluted weighted average shares outstanding | $ | 95,600 | $ | 97,060 | $ | 96,674 |
| Net cash provided by operating activities |
$ | 173,565 | $ | 184,562 | $ | 196,242 |
* Of the $1.15 in cash dividends declared per common share for the year ended December 31, 2007, $0.50 per share was declared and paid in 2007. On December 11, 2007, the Board of Directors declared a special dividend of $0.50 per common share, which was paid on January 24, 2008 to stockholders of record on January 4, 2008, and a regular quarterly dividend of $0.15 per common share, which was paid on March 30, 2008 to stockholders of record on March 3, 2008.
** In total, $1.10 in cash dividends per common share was paid in 2008, of which $0.65 in cash dividends per common share was declared in 2007 and $0.45 per common share was declared in 2008. On December 5, 2008, the Board of Directors declared a regular quarterly dividend of $0.20 per common share, which was paid on March 31, 2009 to stockholders of record on March 2, 2009.
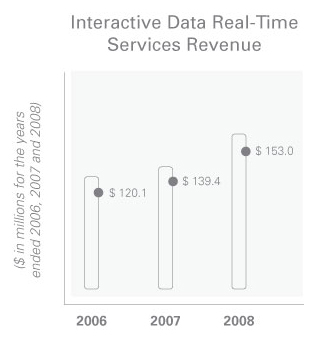
Revenue Details
| (in thousands, except percent data) | ||||||
| 2006* | 2007** | 2008*** | ||||
Institutional Services |
||||||
| Interactive Data Pricing and Reference Data |
$ | 377,896 | $ | 429,420 | $ | 475,803 |
| Interactive Data Real-Time Services |
$ | 120,061 | $ | 139,385 | $ | 152,989 |
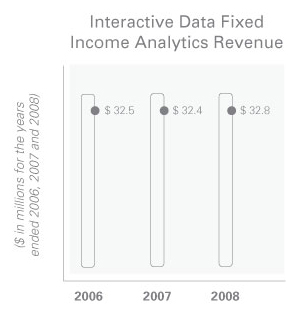
| Interactive Data Fixed Income Analytics |
$ | 32,459 | $ | 32,442 | $ | 32,846 |
| Institutional Services total | $ | 530,416 | $ | 601,247 | $ | 661,638 |
| Percent of total revenue | $ | 86.6% | $ | 87.2% | $ | 88.2% |
Active Trader Services |
||||||
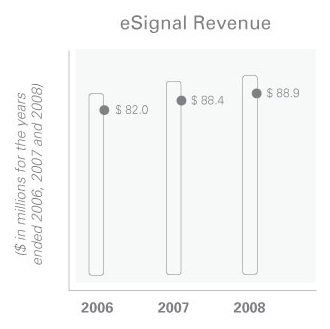
| eSignal |
$ | 81,987 | $ | 88,363 | $ | 88,903 |
| Active Trader Services total | $ | 81,987 | $ | 88,363 | $ | 88,903 |
| Percent of total revenue | $ | 13.4% | $ | 12.8% | $ | 11.8% |
| Total revenue | $ | 612,403 | $ | 689,610 | $ | 750,541 |
* Revenue for the eSignal business in 2006 included $10,045 associated with the Quote.com business that we acquired in March 2006. Revenue for the Interactive Data Real-Time Services business in 2006 included incremental revenue of $41,733 related to the IS.Teledata business we acquired in December 2005.
** Revenue for the eSignal business in 2007 included incremental revenue of $2,372 related to the Quote.com business we acquired in March 2006. Revenue for the Interactive Data Pricing and Reference Data business in 2007 included $5,299 related to the Xcitek business we acquired in May 2007.
*** Revenue for the Interactive Data Pricing and Reference Data business in 2008 included $3,617 related to the Kler’s and NDF businesses we acquired in August 2008 and December 2008, respectively, as well as incremental revenue of $3,058 related to the Xcitek business we acquired in May 2007.